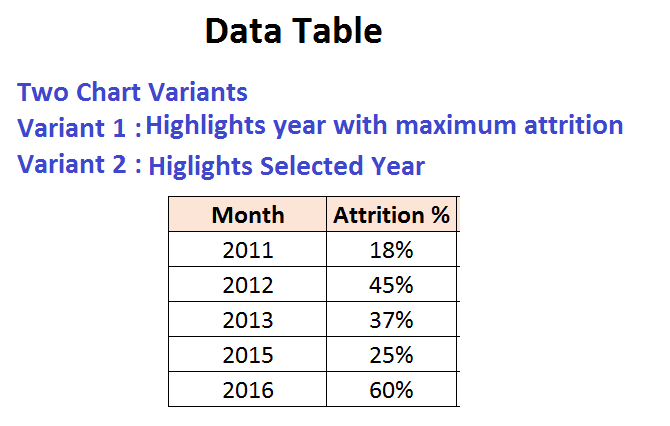
There are two variants of this chart
- Highlighting the year with maximum attrition
- Highlighting the selected year.
The user can adopt this chart and create more variations like years having above attrition highlighted or separating a yearly attrition across departments /locations and then highlighting the department/location with highest attrition.